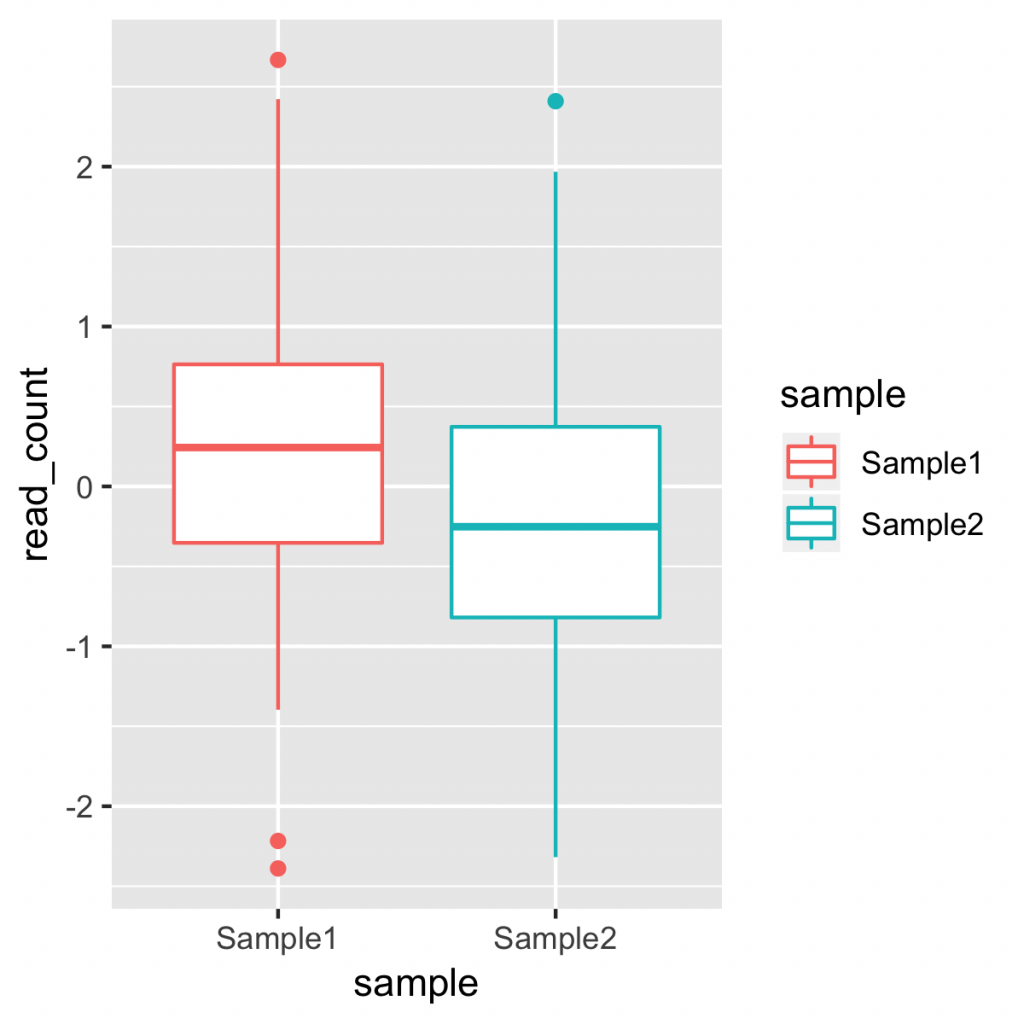
ggplot2 では、あるパラメーターごとに色付けすることが簡単にできます。色付けするには、aes() の指定時、 color にパラメーターを指定します。サンプルごとに異なる色を付けるには、下記のように指定します。
g <- ggplot(plot_data, aes(x = sample, y = read_count, color = sample))
自動的に選択された色で、色づけされます。
一方、ボックスプロットの枠ではなく、中身を色付けしたい場合は、 color ではなく、 fill で指定します。
g <- ggplot(plot_data, aes(x = sample, y = read_count, fill = sample))
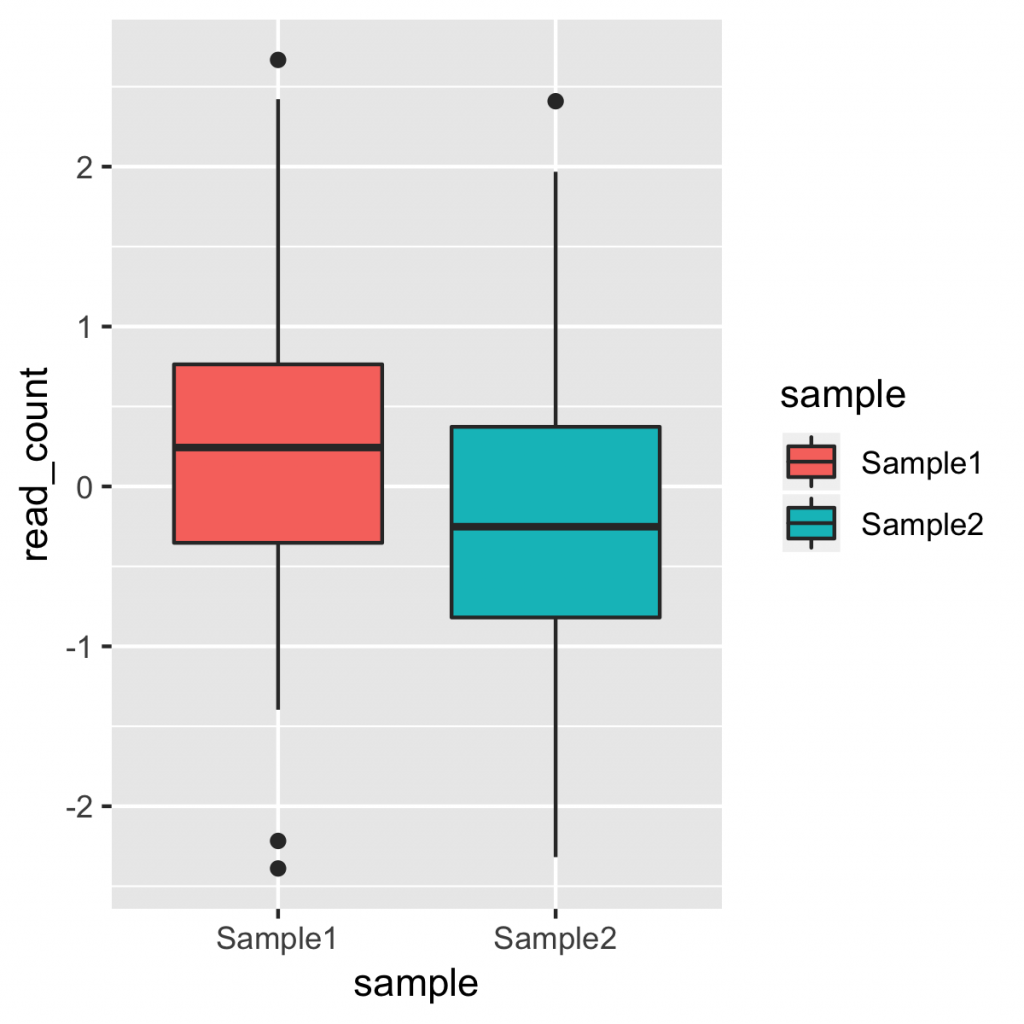
コードの例:
input_data <- tibble("Sample1" = rnorm(100),
                     "Sample2" = rnorm(100))

plot_data <- input_data %>%
  gather(Sample1, Sample2, key = "sample", value = "read_count")

g <- ggplot(plot_data, aes(x = sample, y = read_count, fill = sample))
g + geom_boxplot()
ggsave("boxplot_image_fill.png", width = 4, height = 4, unit = "in")
「ggplot2: ボックスプロットに色を付ける」への2件のフィードバック
コメントは停止中です。